1. Physics
Sound is a pressure wave, pressure fluctuations move through space,but each air particle moves only a small distance.

While using a microphone to capture sounds, the physics behind it is AIR PRESSURE, so the waveform files (.wav/.mp3…) will have negative and positive value!
2. Spectrums
The spectrums of a sound plays a center role in determining its quality
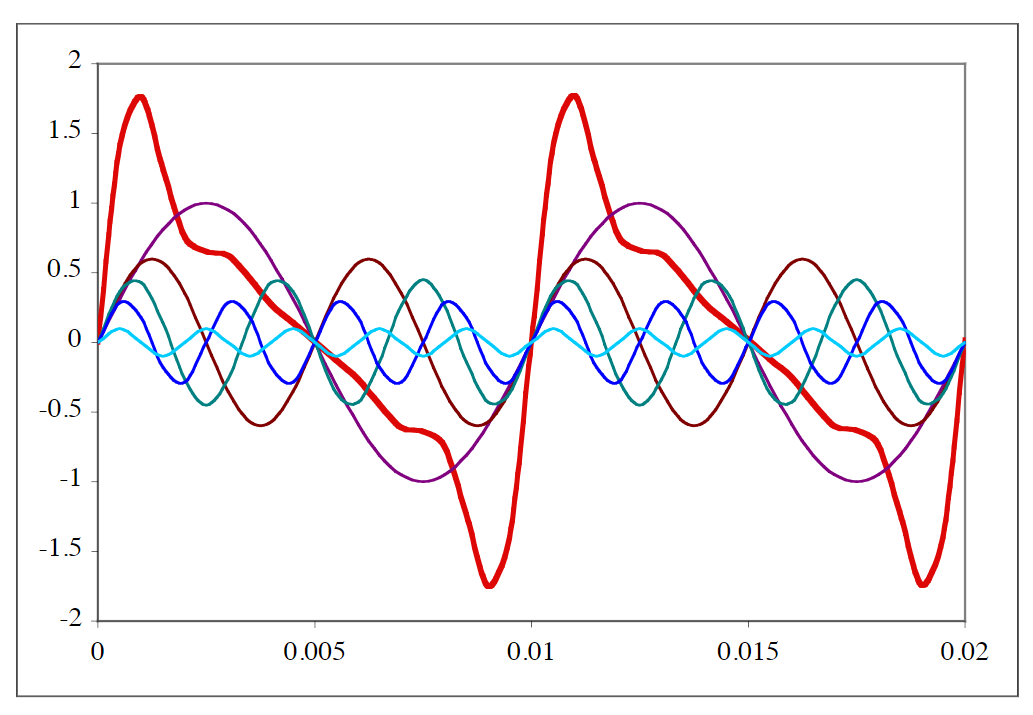
we can represent the sound in frequency plot

- the quality of a vowel depends on the shape of its spectrum
- the peaks are called formants
- the quality depends primarily on the first three formant
3. Spectrogram
A spectrogram is a visual representation of the spectrum of frequencies of a signal as it varies with time. When applied to an audio signal, spectrograms are sometimes called sonographs, voiceprints, or voicegrams.
Time-Frequency Plot
4. Auditory
4.1. Loudness
Loudness depends on amplitude of the sound wave $\to$ Amplitude is usually measured in the terms of root-mean-square(over some time window)
perceived loudness is more closely related to intensity, proportional to the square of the amplitude, relative intensity in dB = $20log(\frac{x}{r})$
Loudness of pure tone (>40 dB) in Sones:
$$
N=2^{\frac{(dB-40)}{10}}
$$
5. Sampling
What sampling rate? Due to Nyquist Theorem, twice that frequency
Since the highest frequency ears can perceive is about $20kHz$, we must sample at $2\times20kHz=40kHz$
However, almost all of the information relevant to speech sounds is below $10kHz$, so $20kHz$ sampling rate is enough
In practical, we use a sampling rate of $44.1kHz$