1. Inequality Report
Mainly 4 areas
- Income inequality, how it changes
- More detailed evidence
- Gender inequality
- Carbon emission inequality
2. Shockings
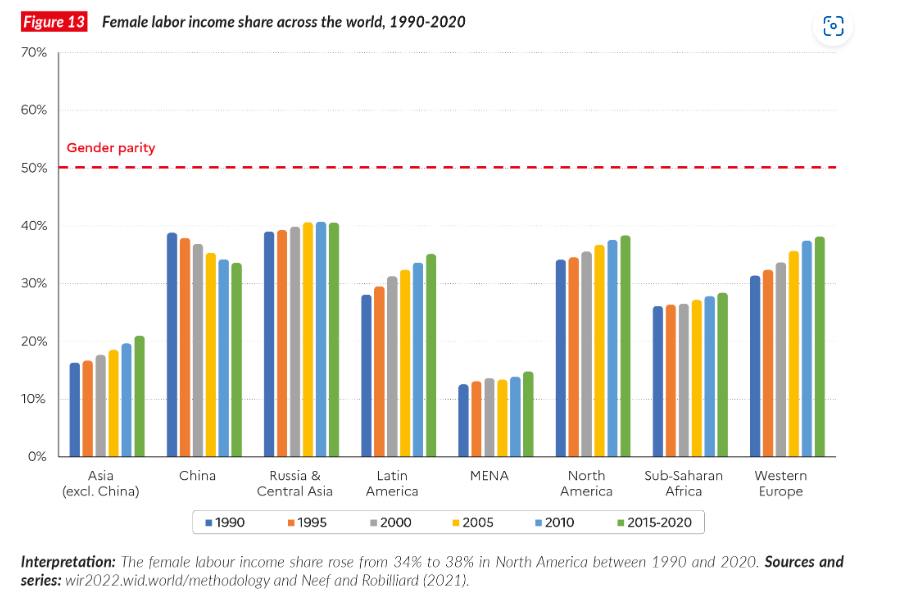
Female labour income rate
Income:
- Richest 10%: 52% income
- Poorest 50%: 8% income
Wealth:
- Richest 10%: 76% wealth
- Poorest 50%: 2% wealth
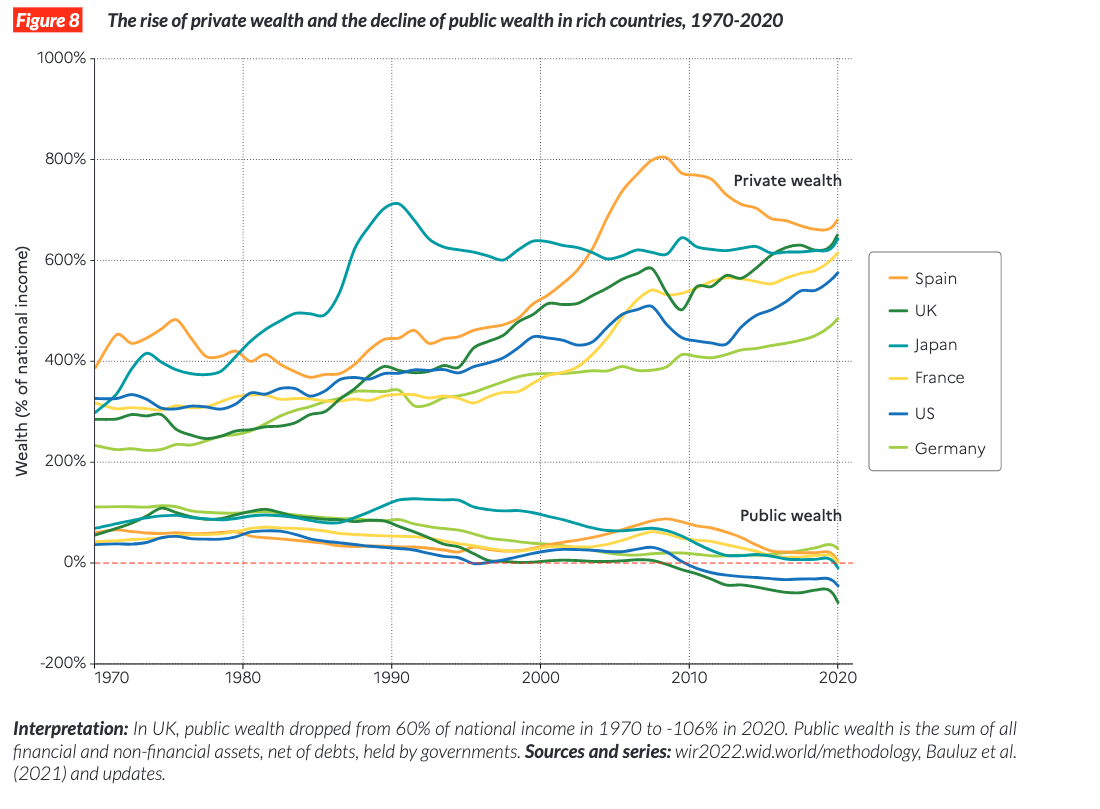
More and more private wealth
Less and less public wealth
De-regulatoin and liberalization program make the wealth inequality even worse
3. Insight
Equally distributed income: 16700 euro/person
Inequality
- Among country
- In the country
Great America
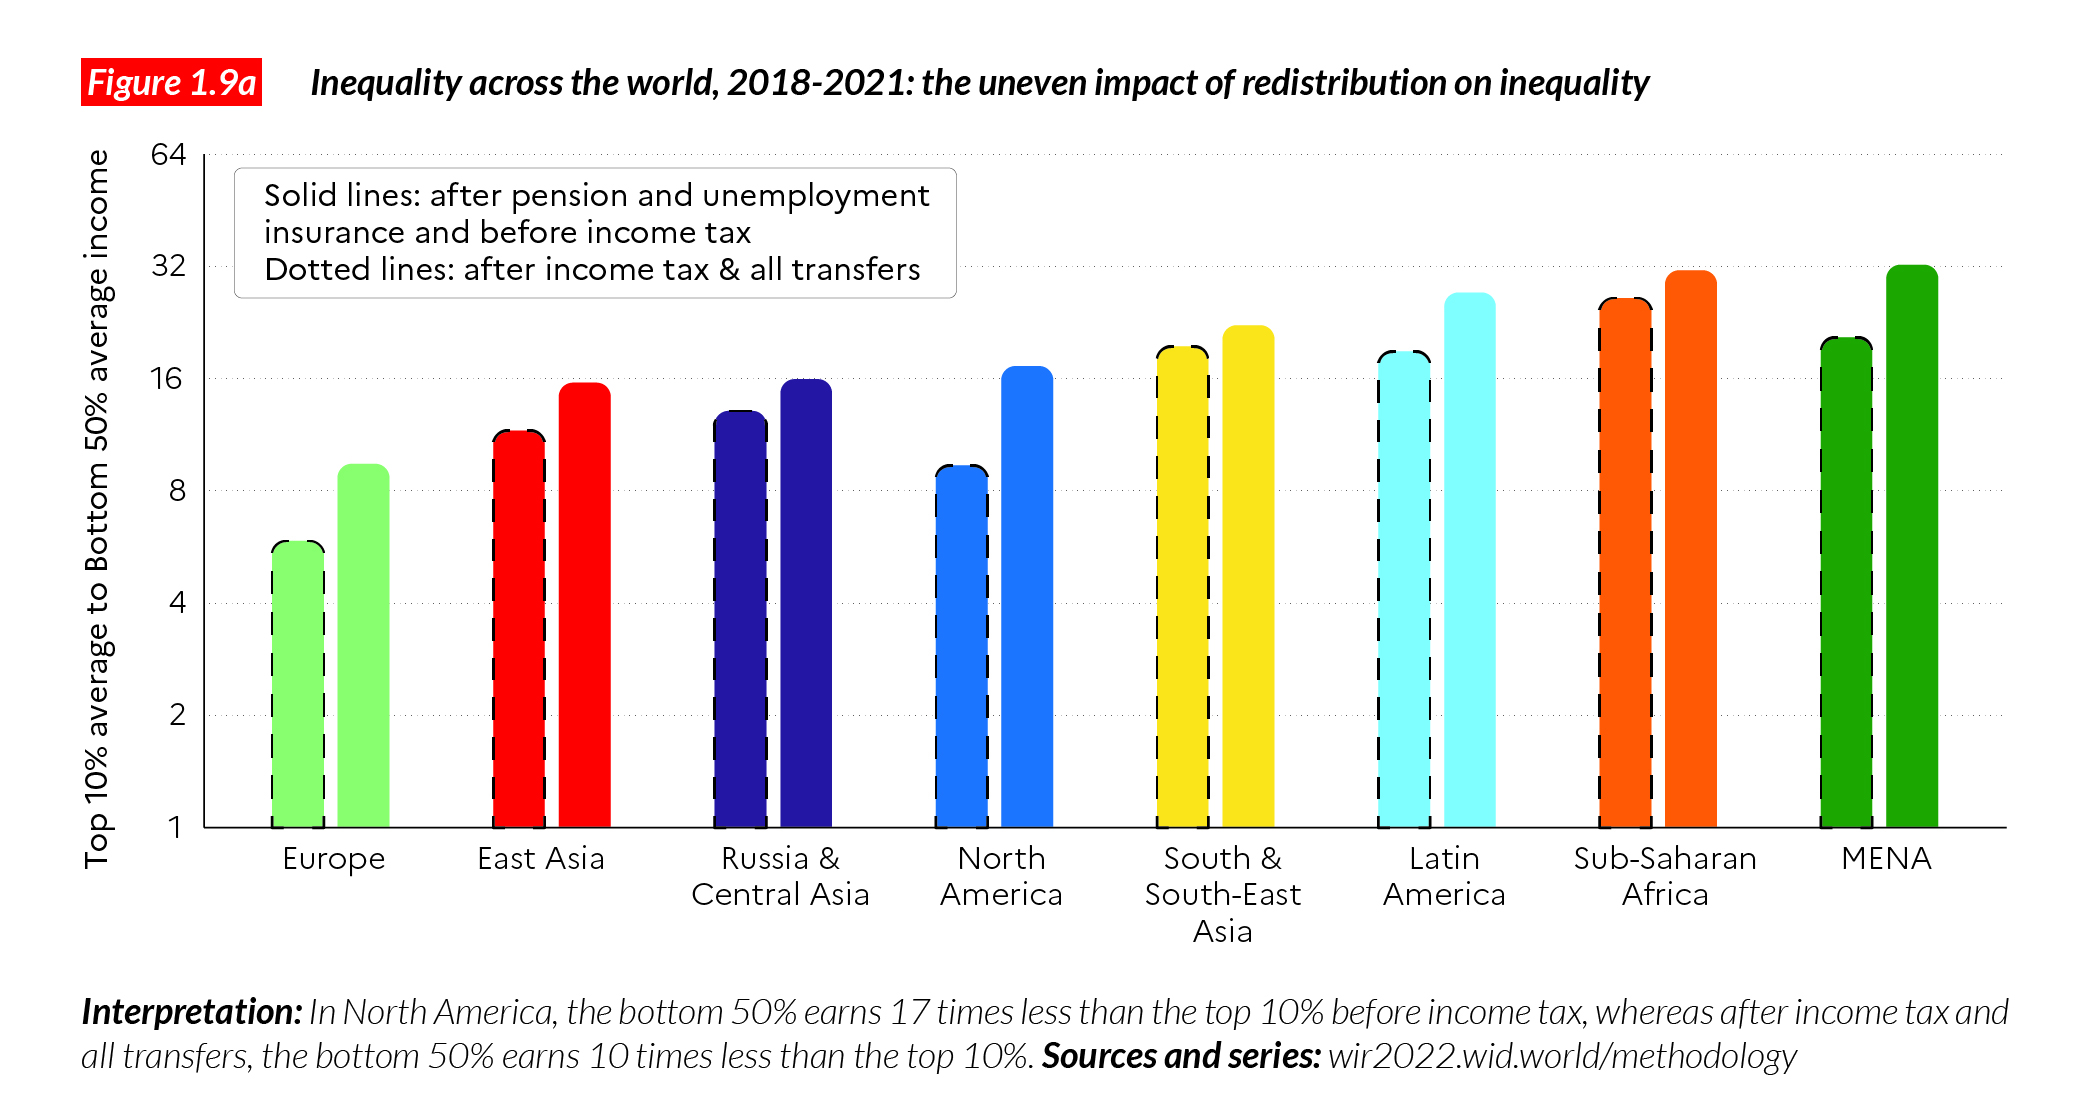
Re-distribution works but not much
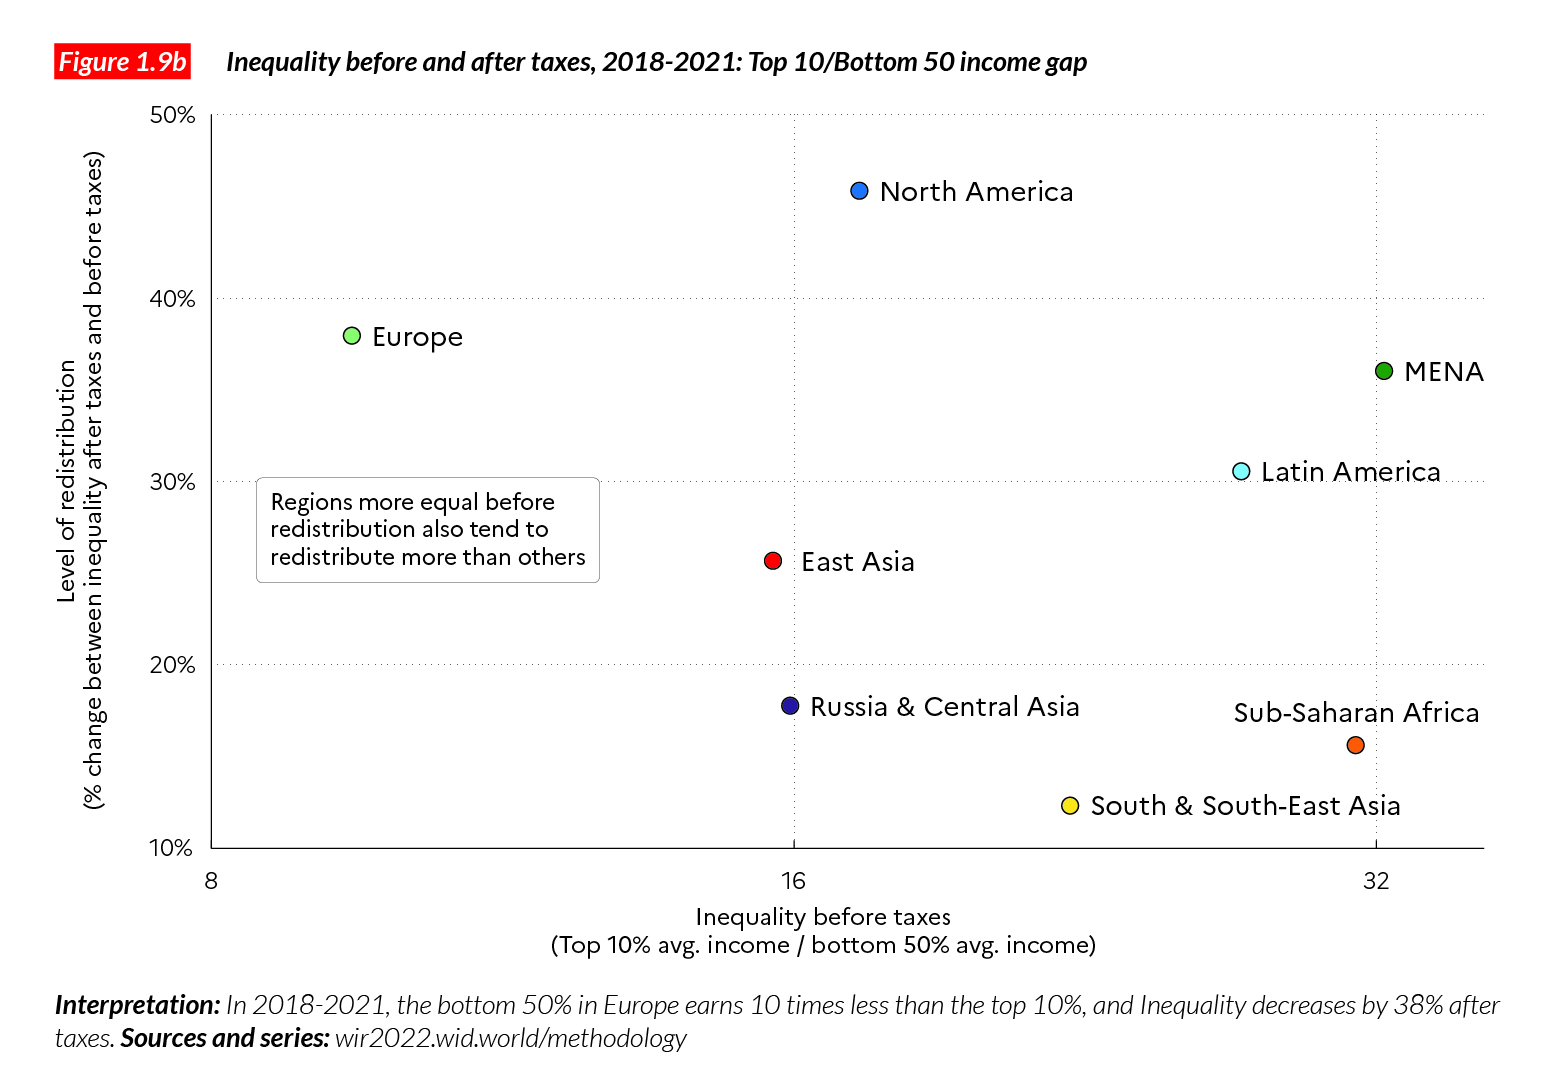
US re-distribution works best, after tax
Takeaway: need more re-distribution, how it works and how to improve
4. Trend
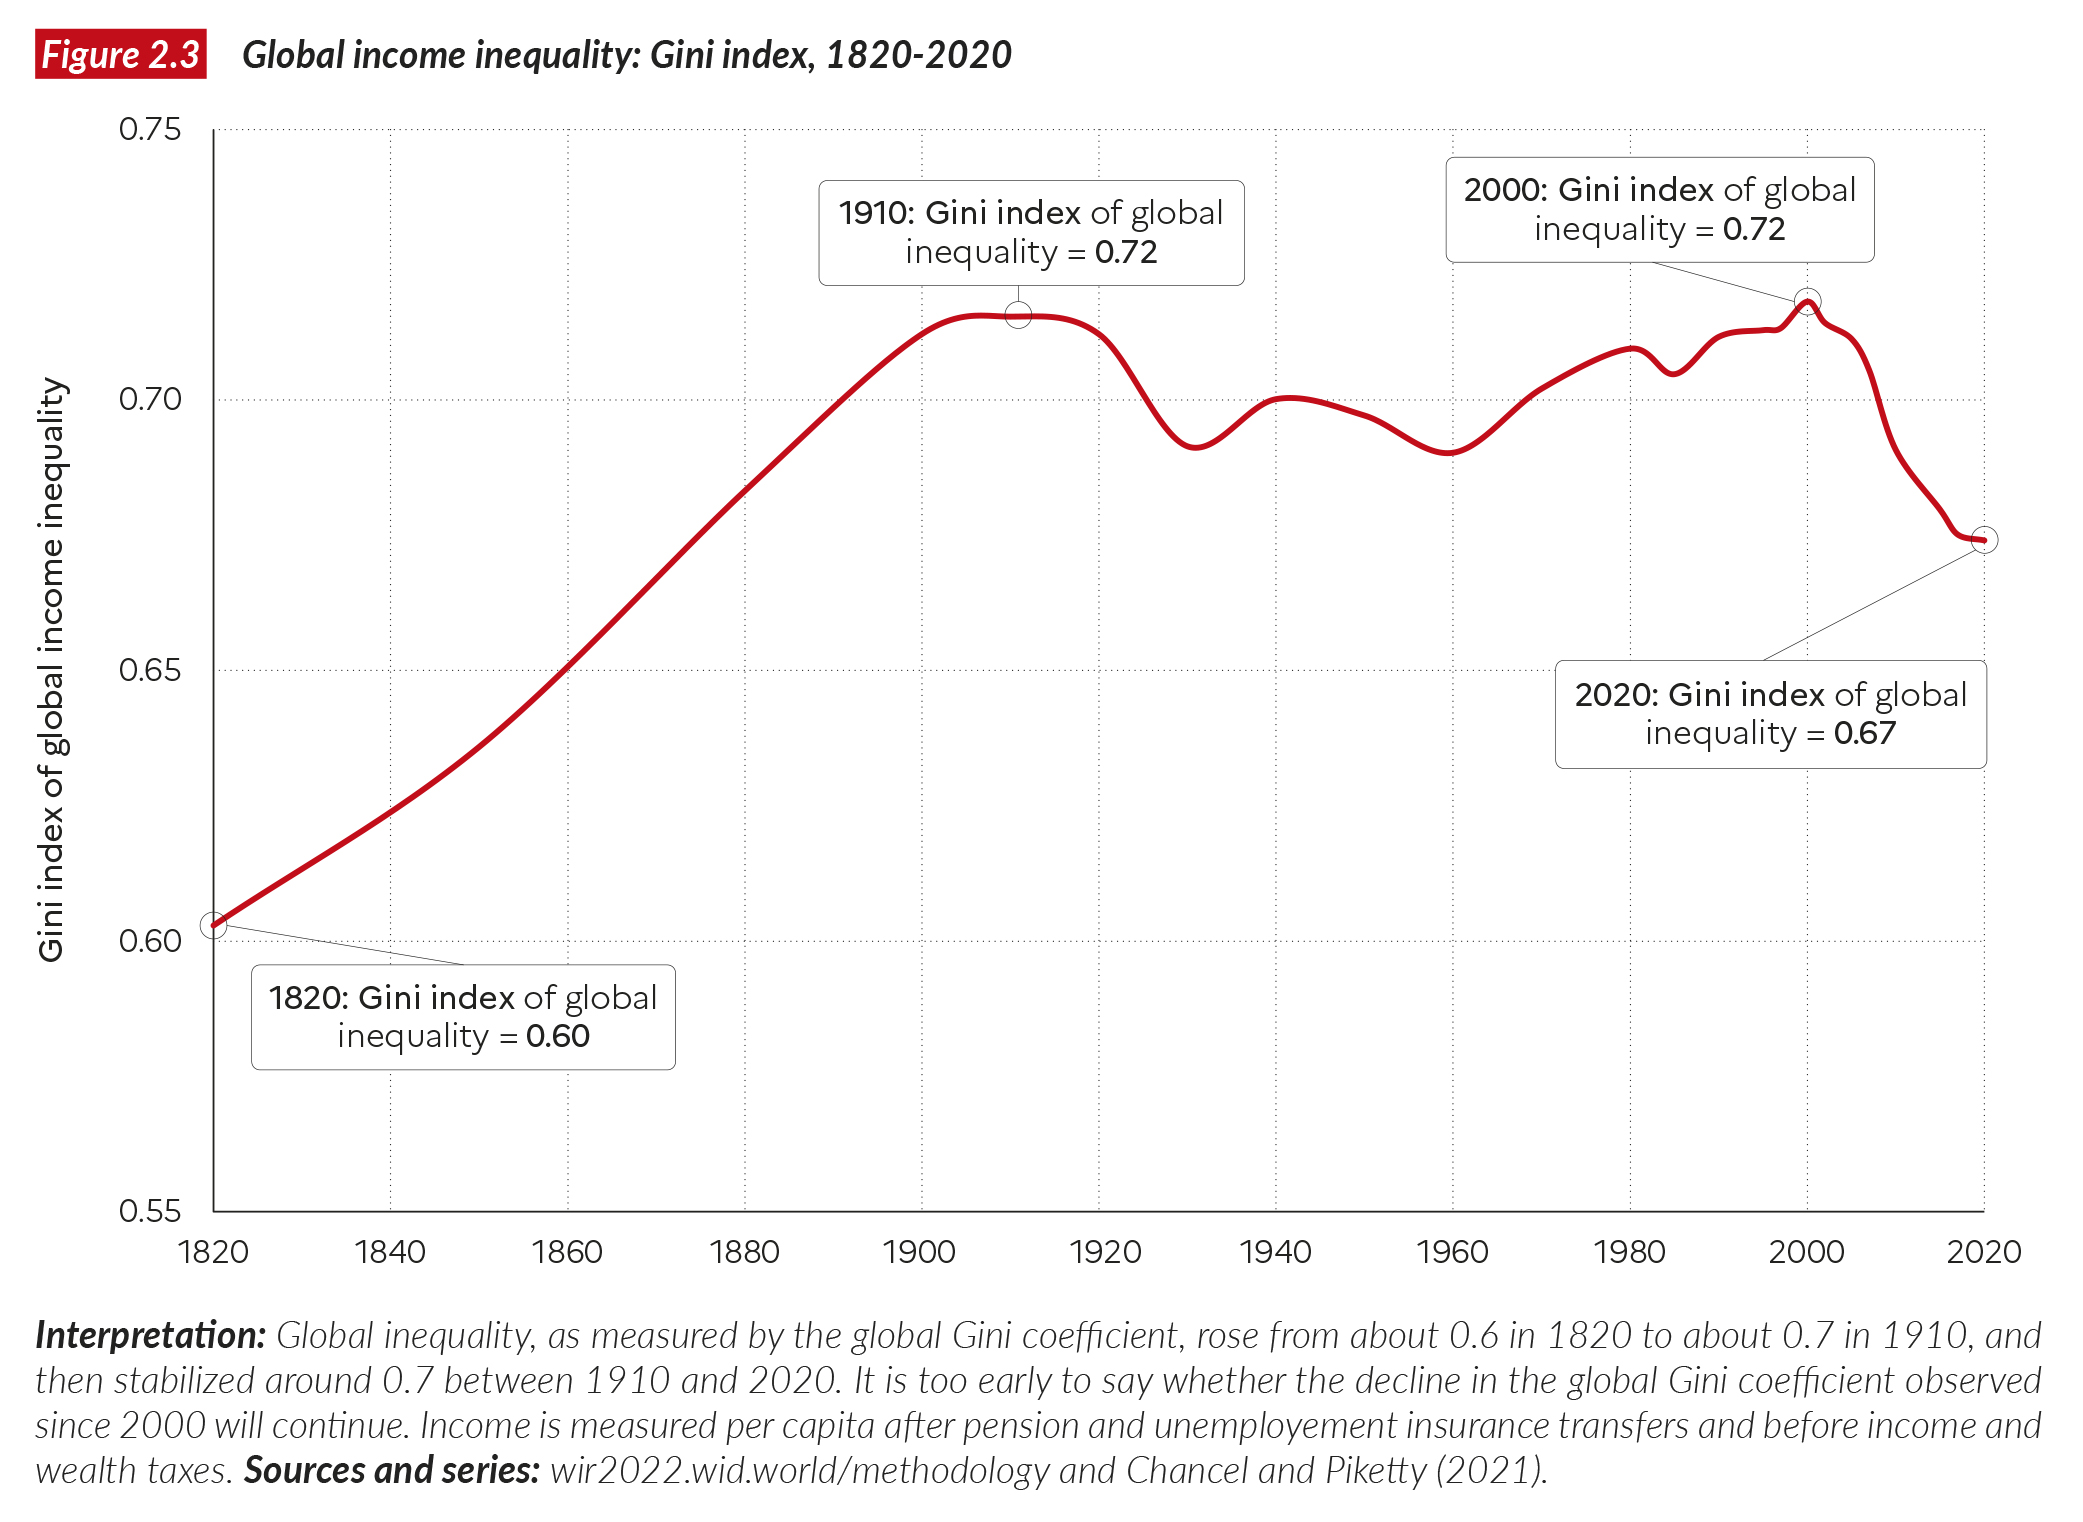
Highest in 1910 and 2000
Only revolution and war can help
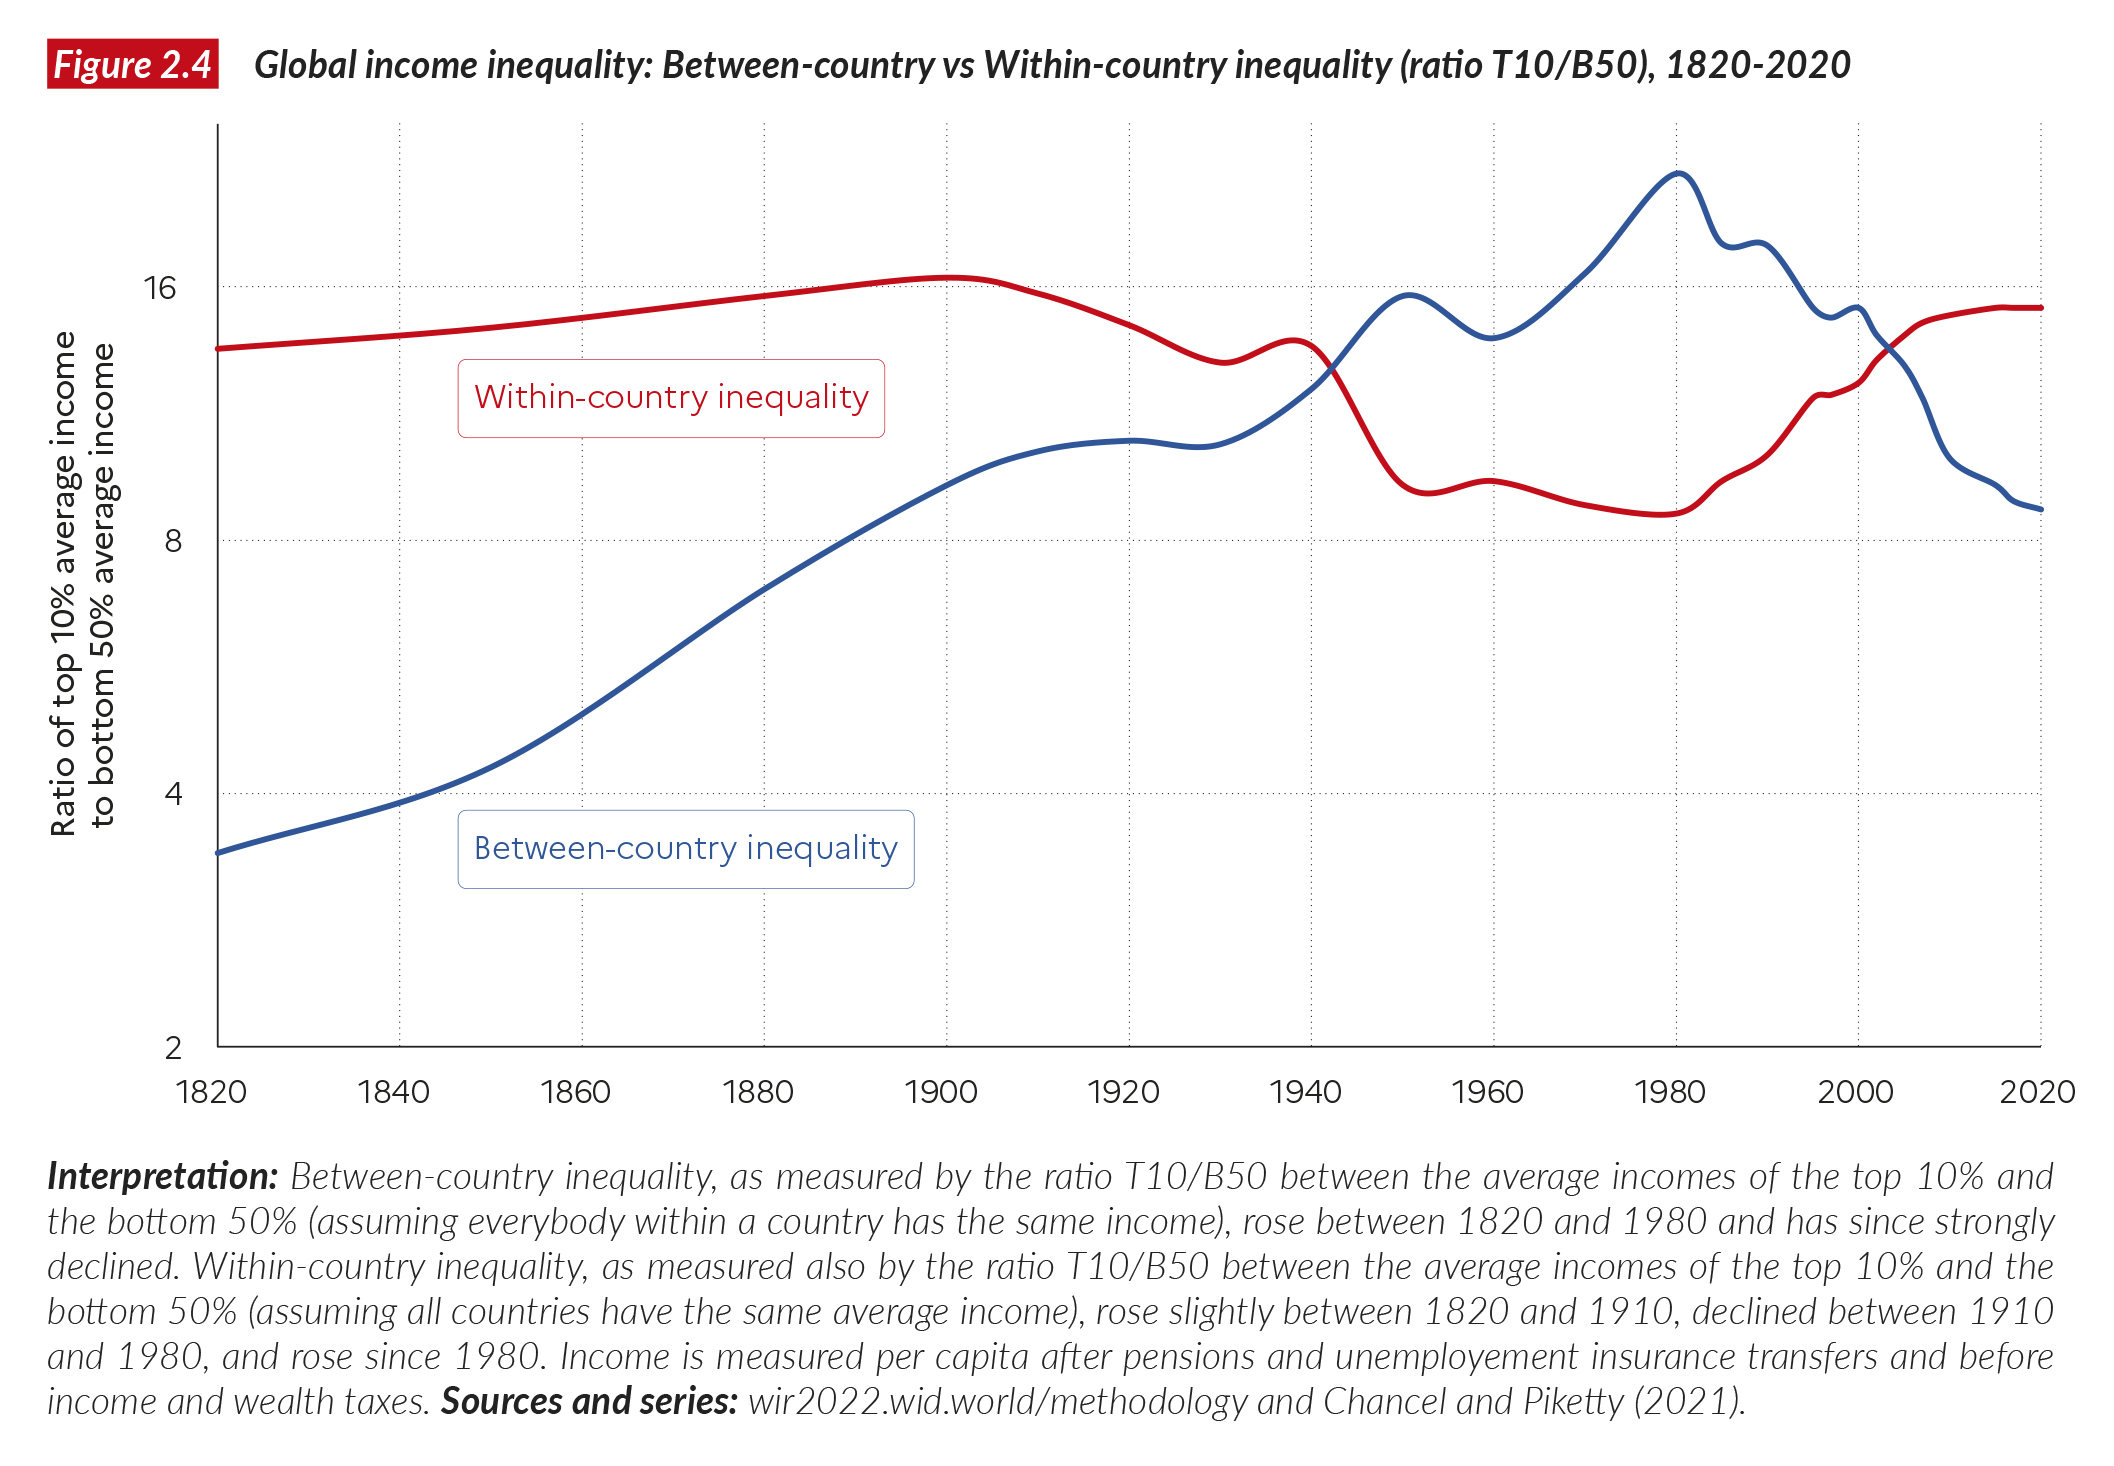
Within-country Inequality is more sever
Takeaway: Consider more on the inequality within-country rather than between-country
5. Poor Government
Wealth arise from
- Capital accumulation, like buildings, equipments, software
- Price effect, value of a house
Wealth include
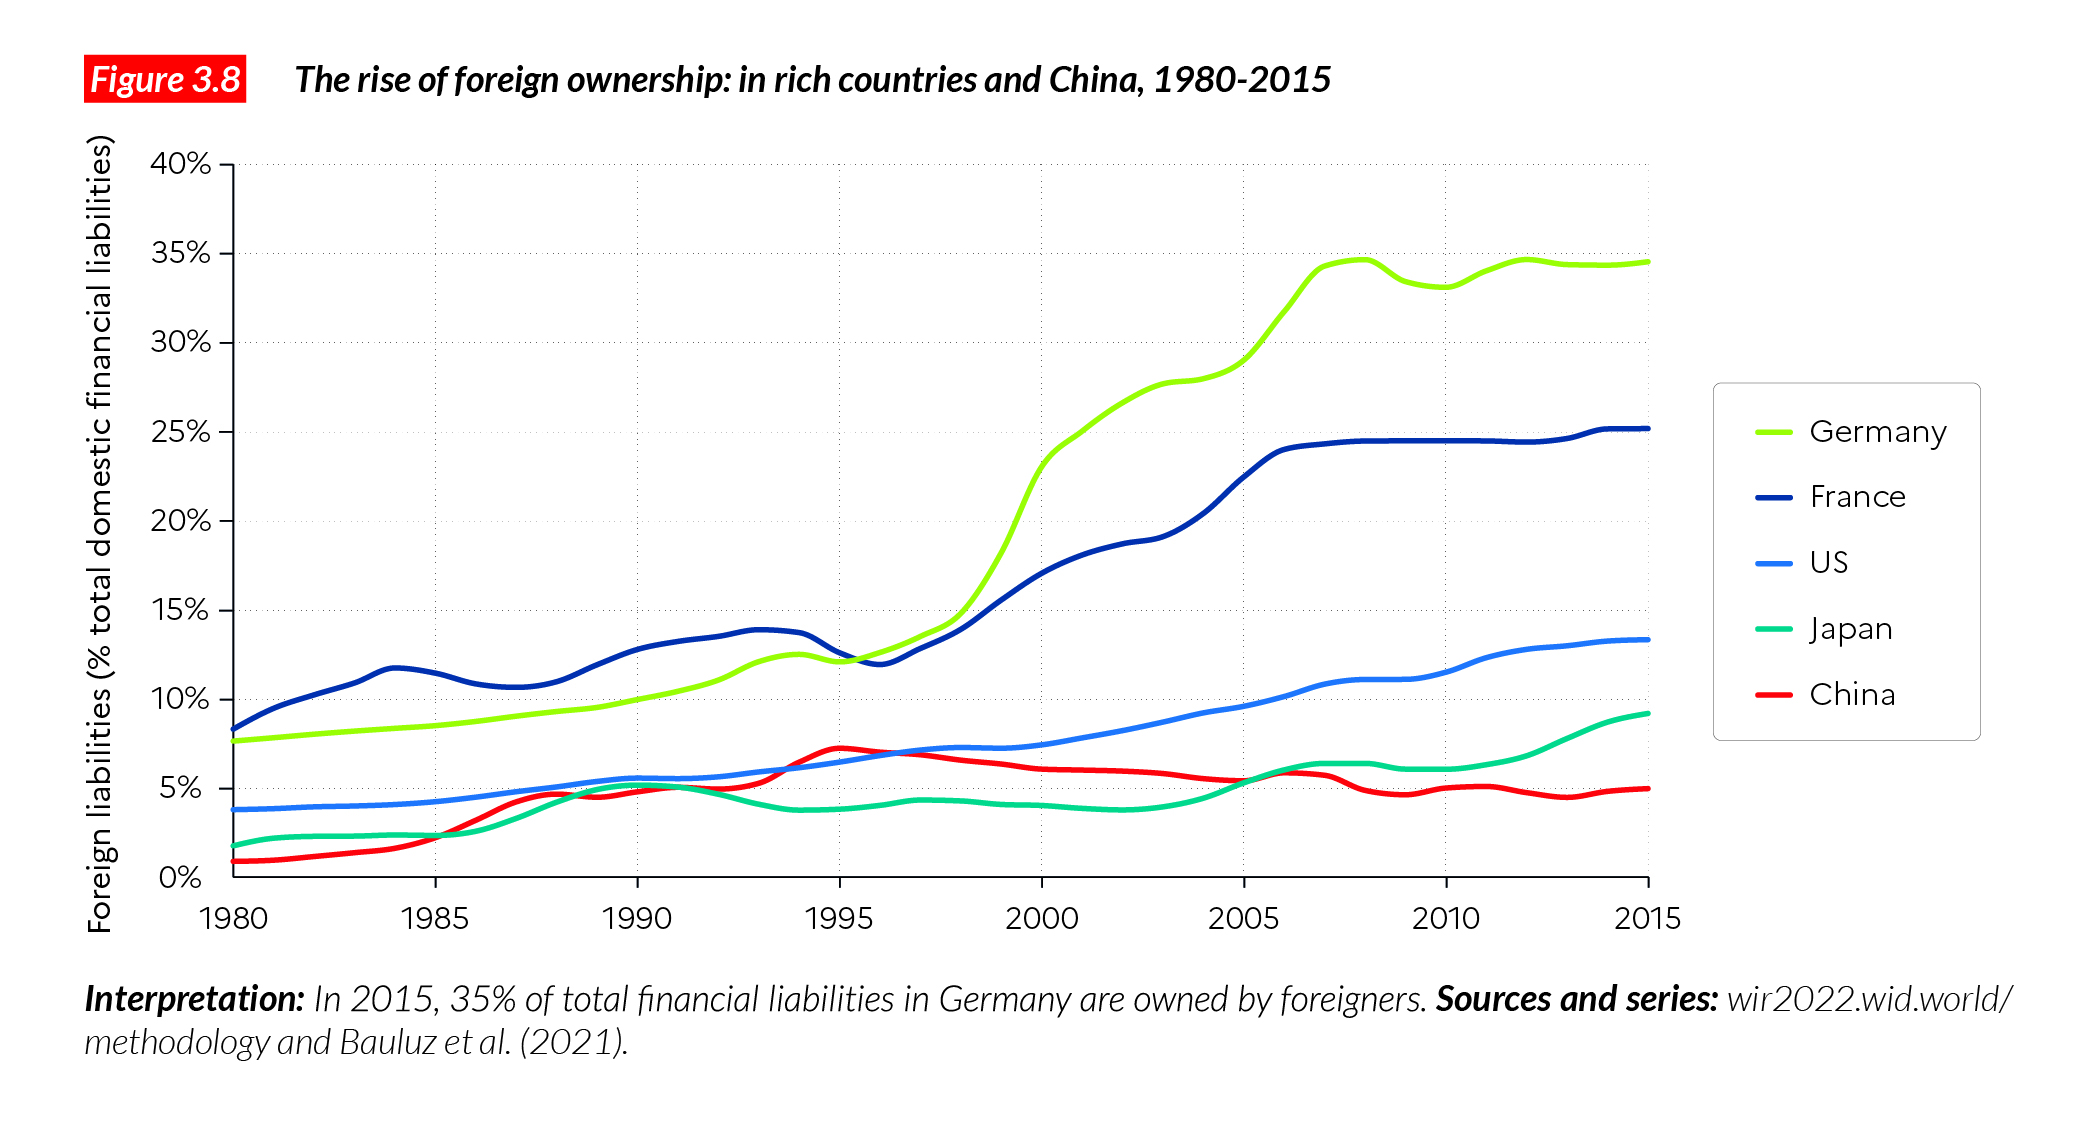
- Financial assets
- Non-financial assets
Wealth owned by
- Private actors
- Public actors
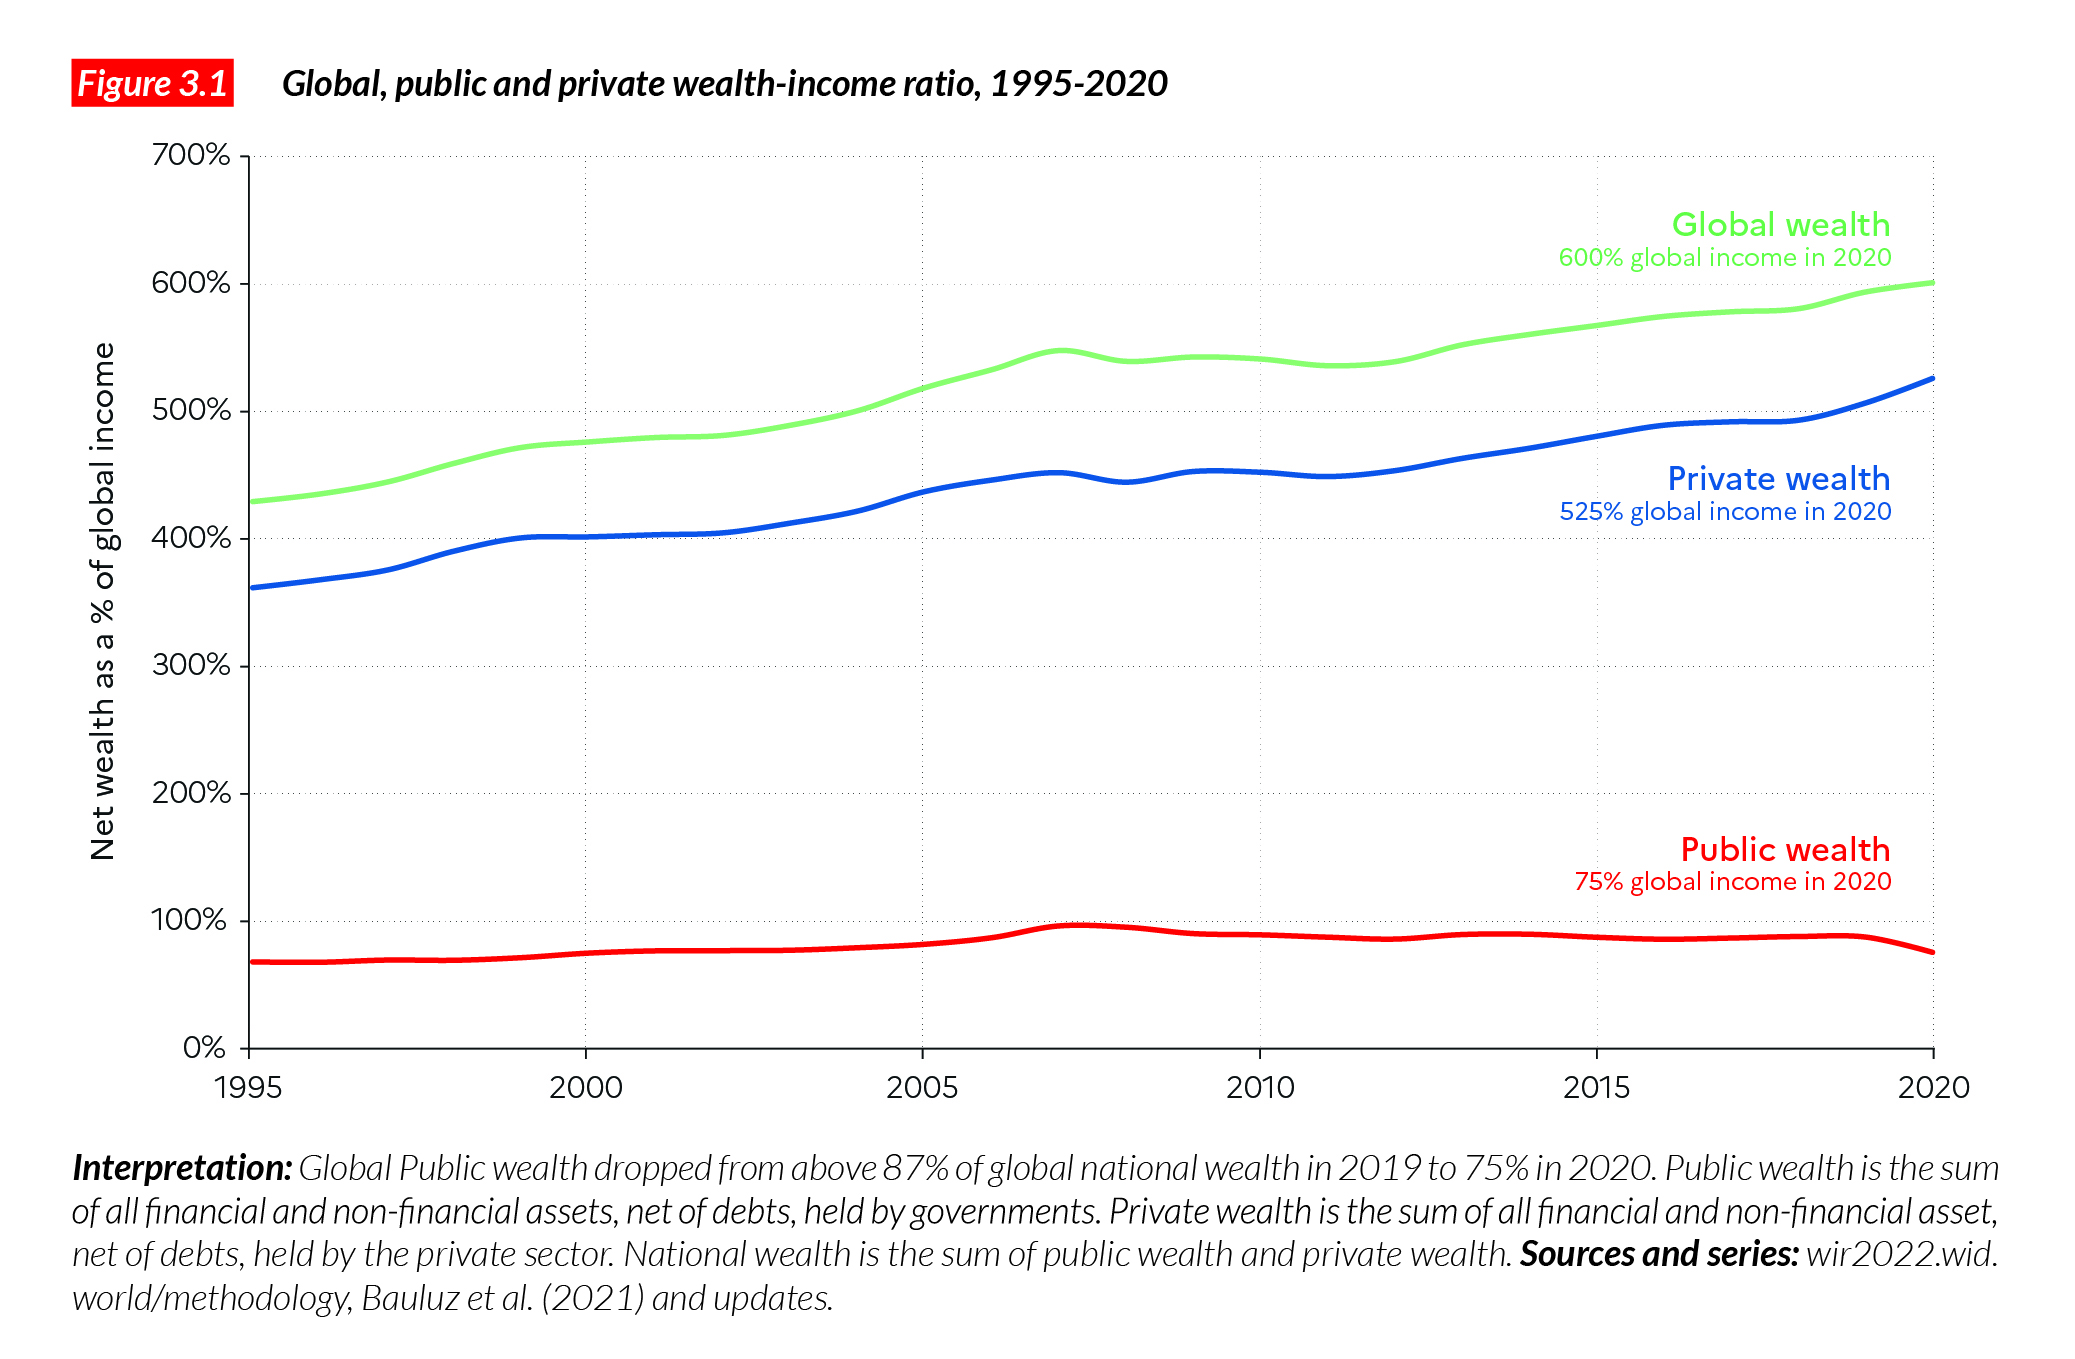
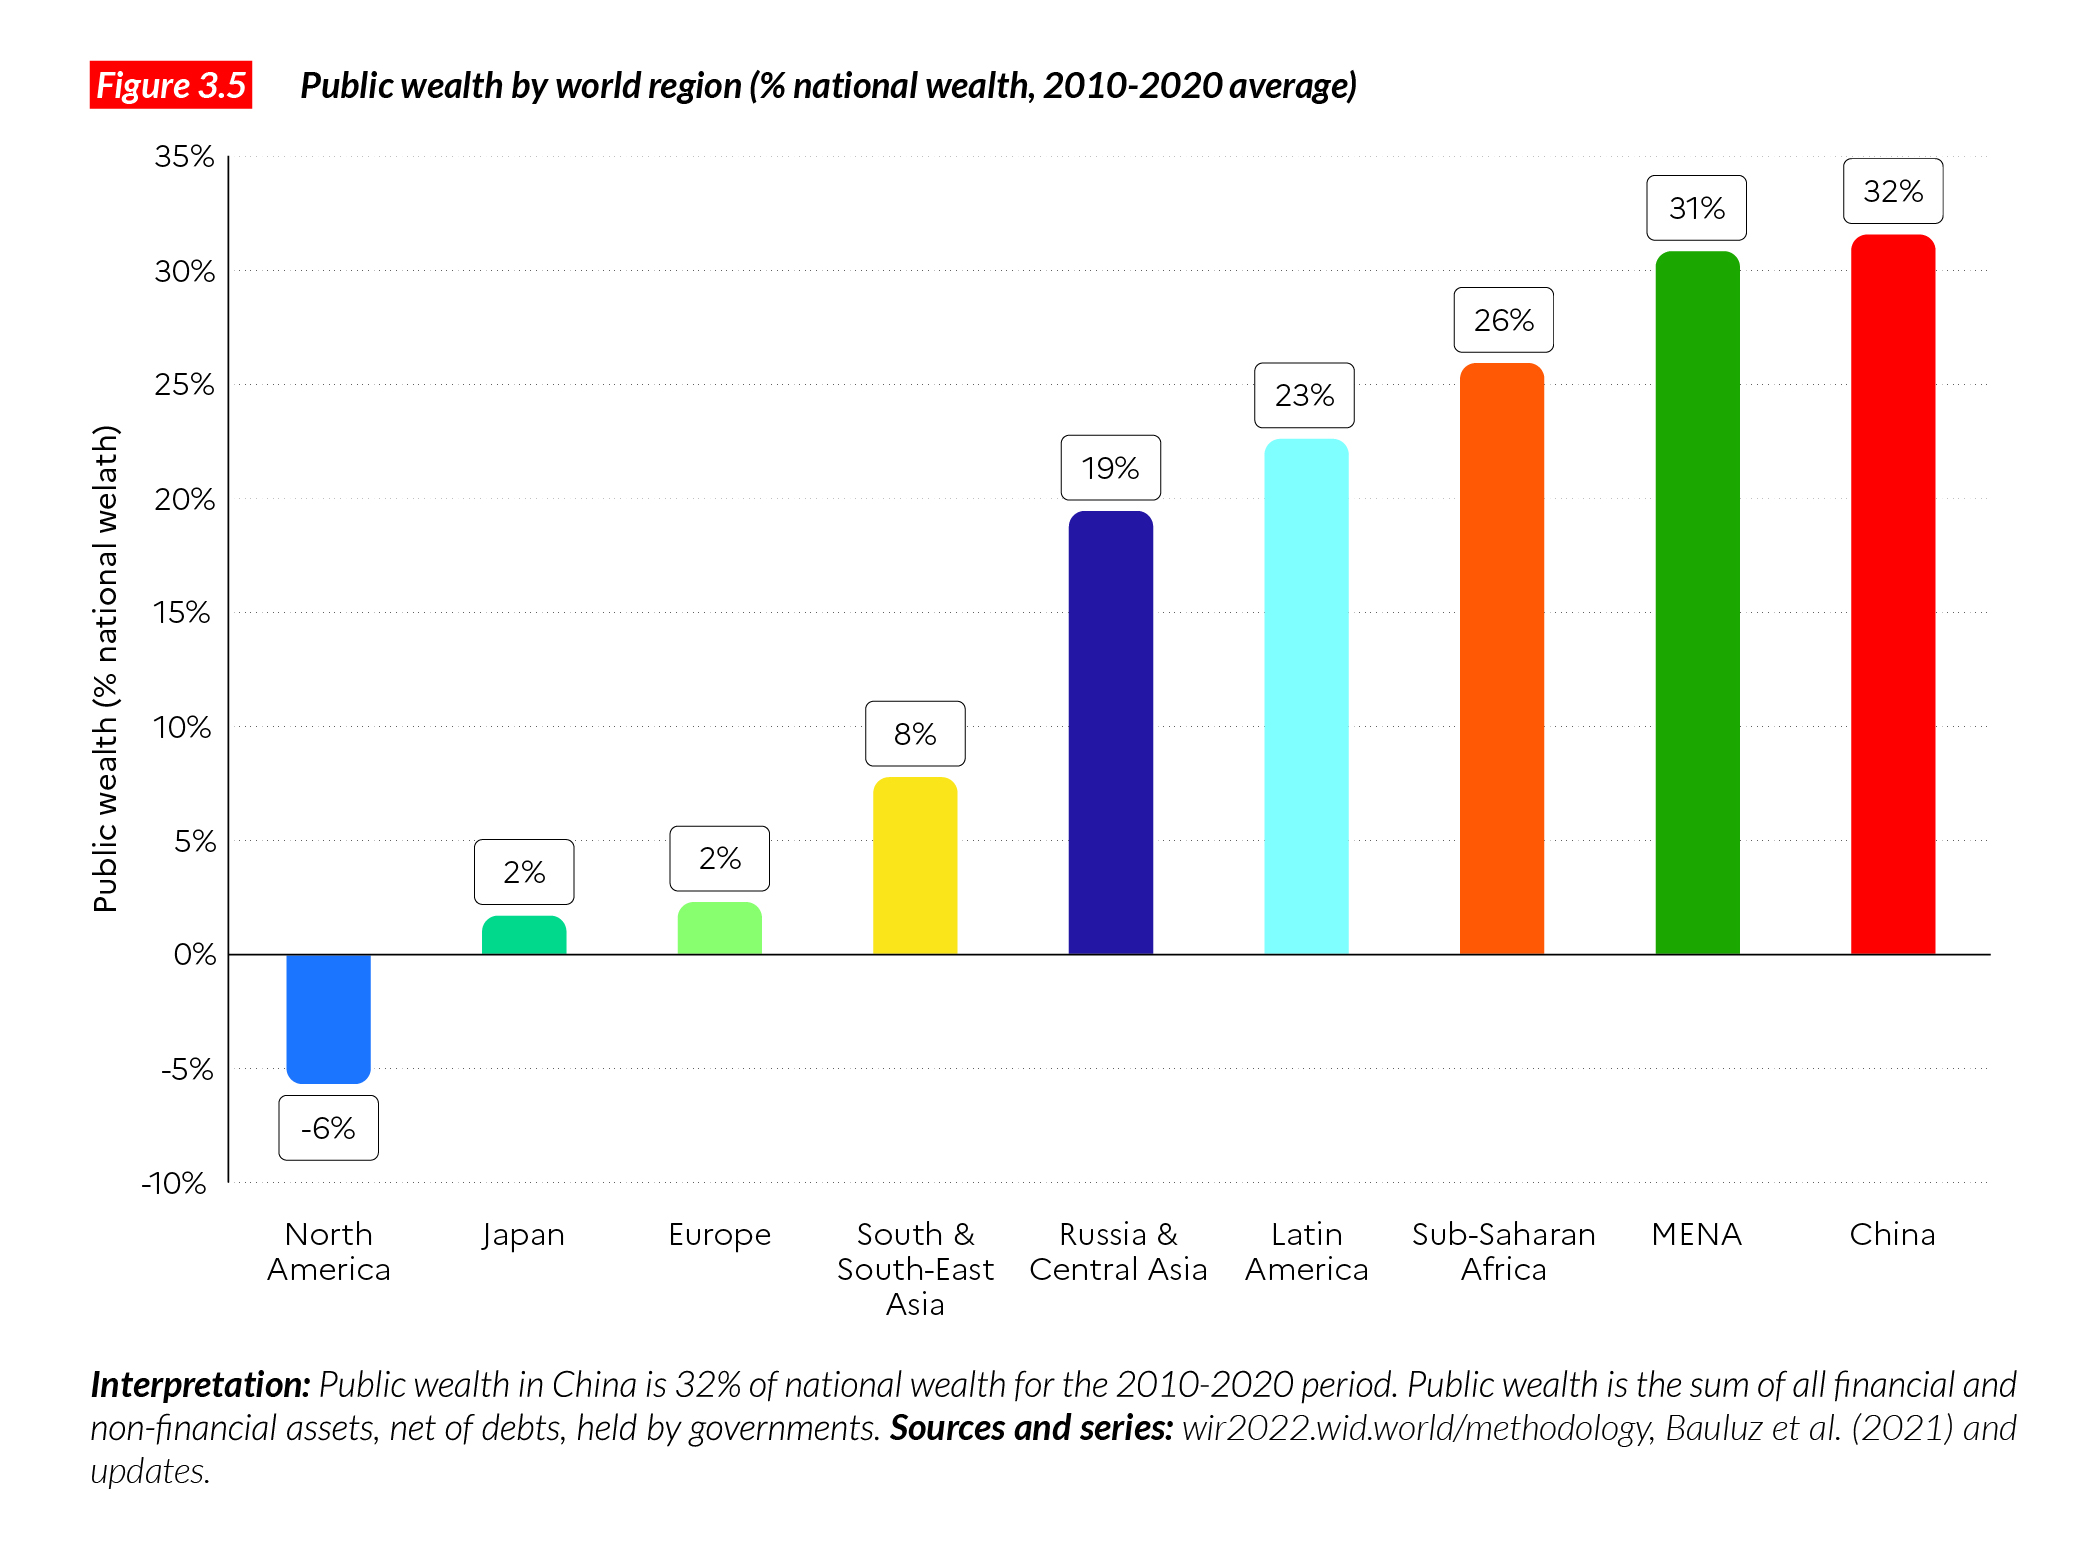
Who own the country?
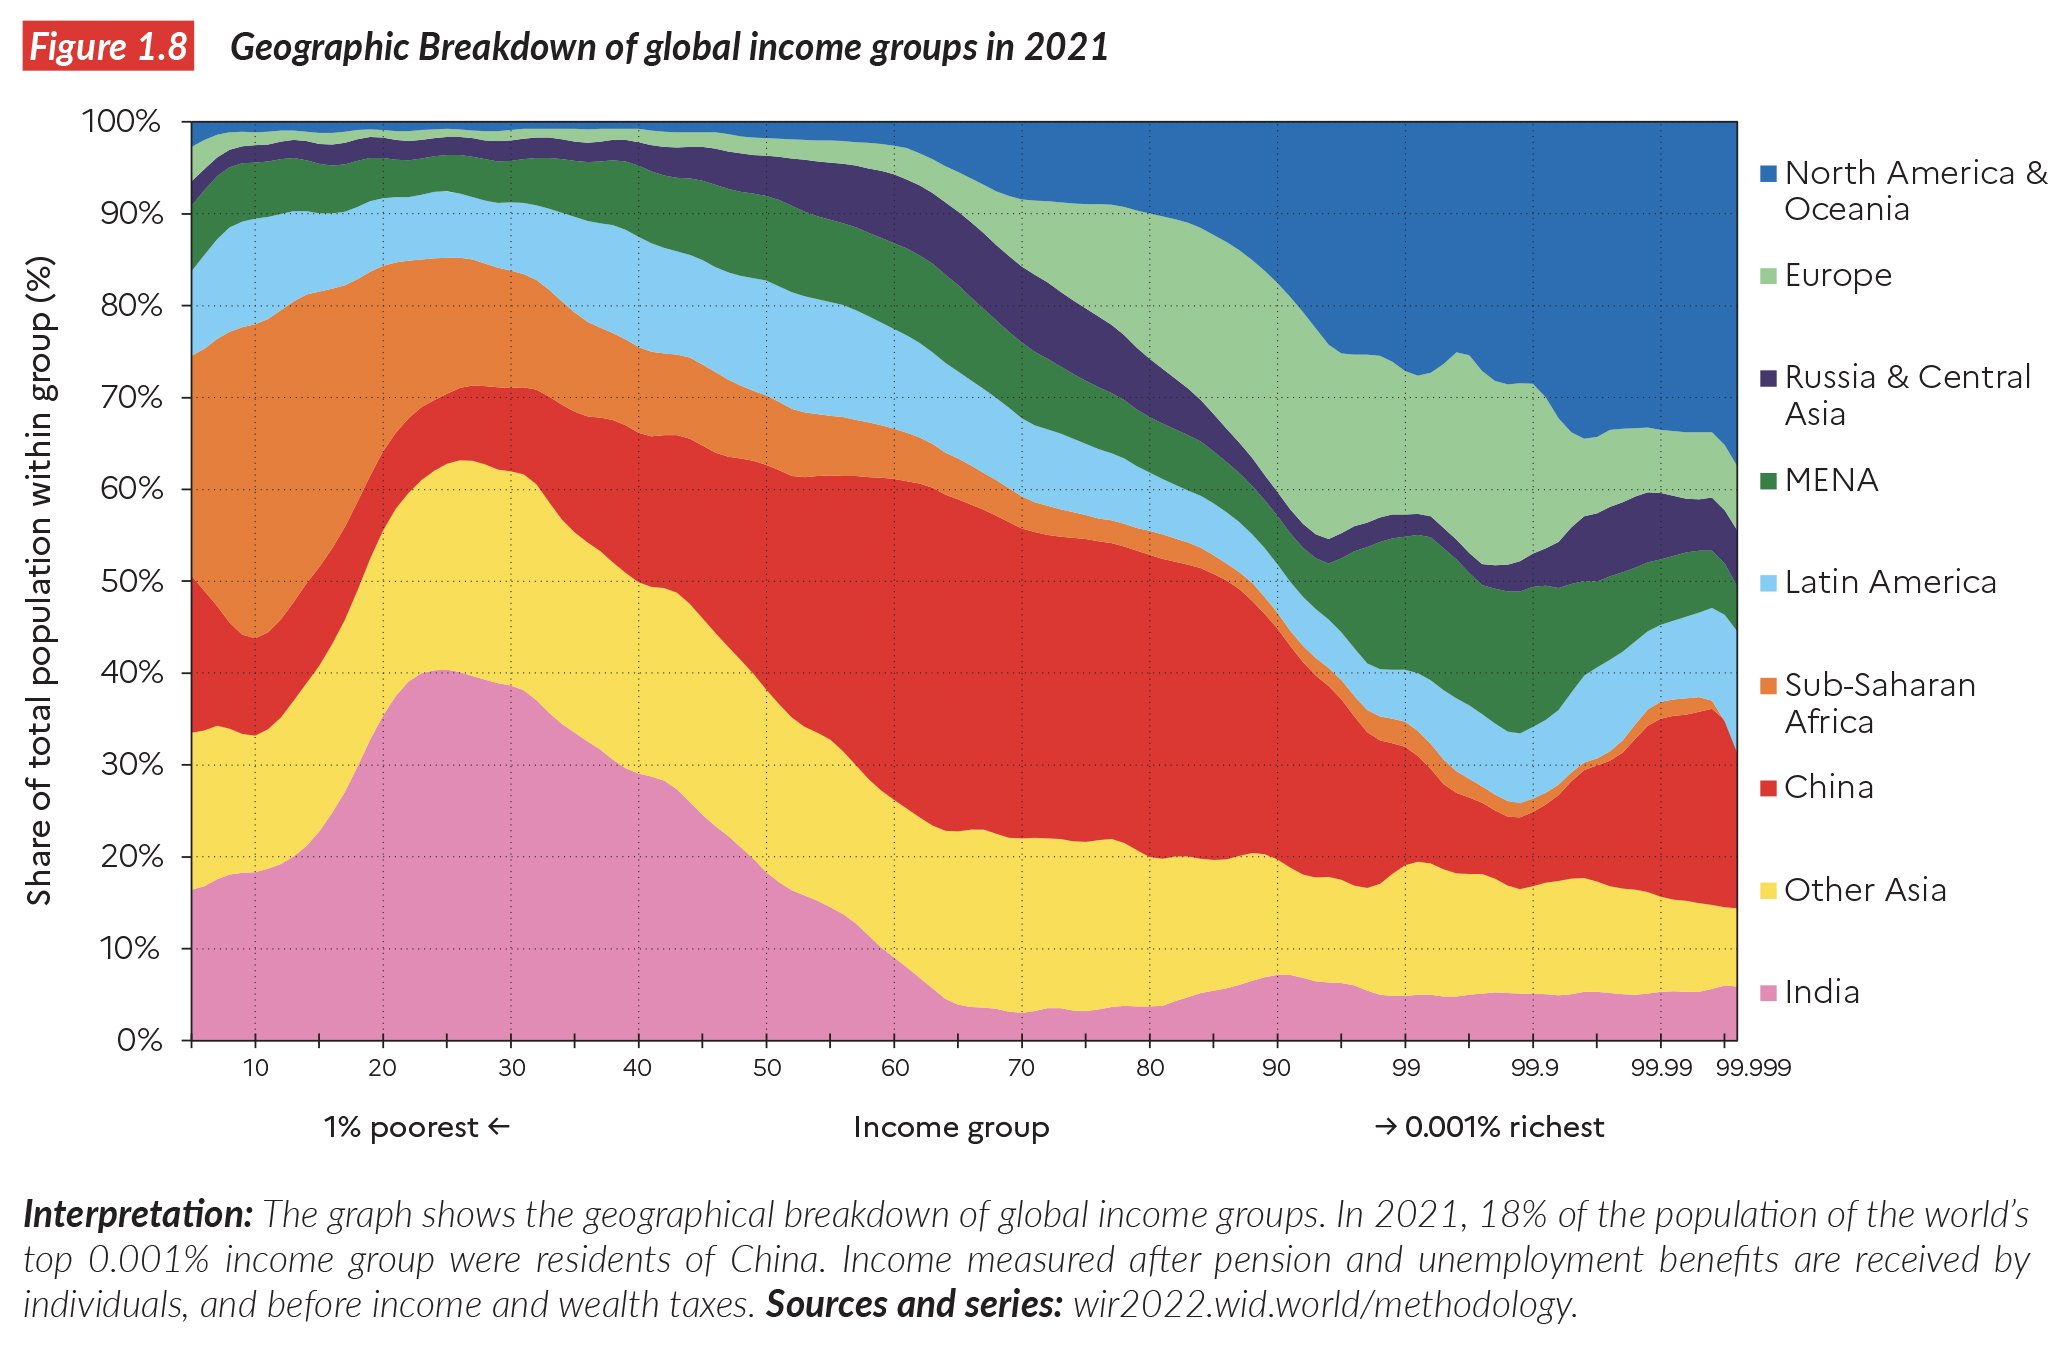
6. Super Rich
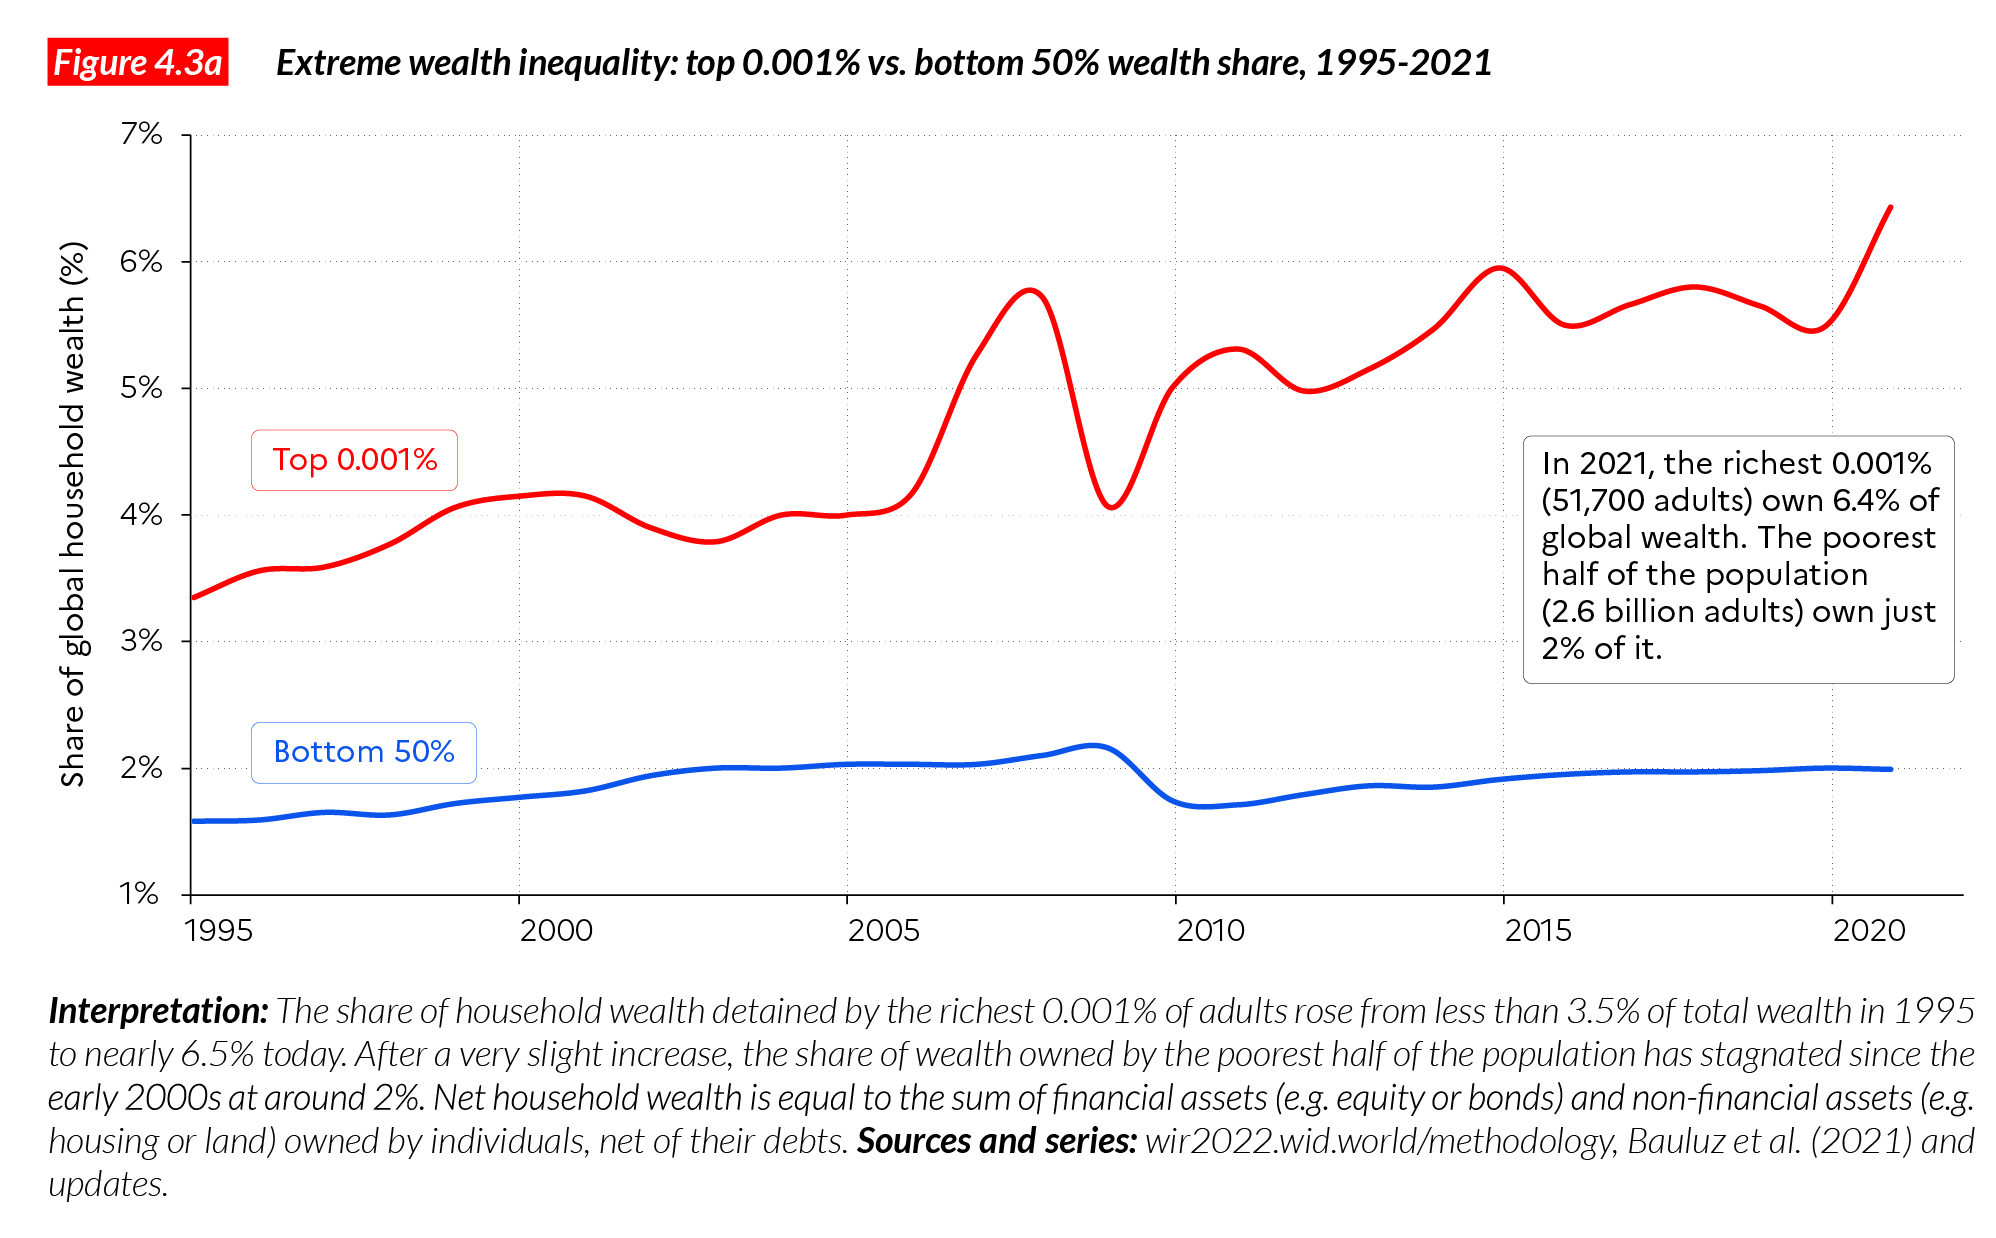
The richest people grow